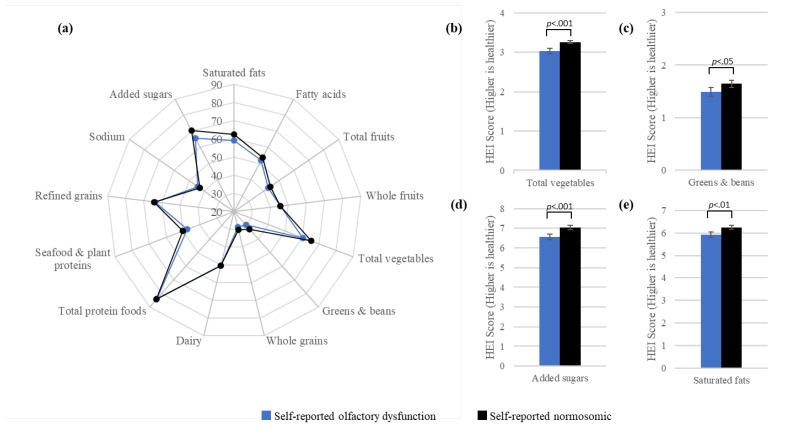
Figure 1.
Visualization of the HEI–2015 component scores by olfactory function among NHANES 2011–2014 participants, aged 40 years and older. The radar graph (a) displays mean HEI–2015 component scores as a percentage of the maximum component score according to self-reported olfactory function, while the bar graphs (b–e) show significant differences in mean component scores by olfactory function for total vegetables (b), greens and beans (c), added sugars (d), and saturated fats (e). Lower scores correspond to lower intake for total vegetables (b) and greens and beans (c), whereas lower scores correspond to higher consumption for added sugars (d) and saturated fats (e).

