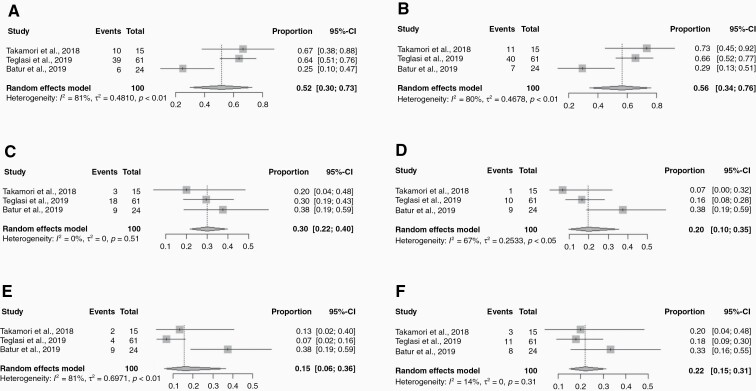
Figure 2.
Forest plots of various cutoff levels of PD-L1 expression in tumor cells (TC) for primary lung tumor and brain metastasis (BM): (A) Lung PD-L1 <1%; (B) BM PD-L1 <1%; (C) Lung PD-L1 1–50%; (D) BM PD-L1 1–50%; (E) Lung PD-L1 >50%; (F) BM PD-L1 >50%. The square boxes correspond to proportions from each study and the size of the box corresponds to the weight of each study, and horizontal line represents 95% confidence interval (CI). The diamonds are pooled estimates of the outcomes with 95% CI.

