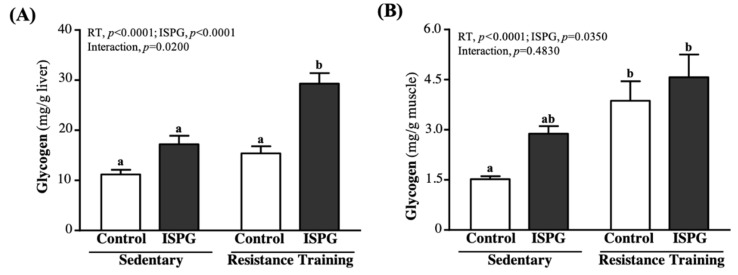
Figure 7.
Effect of ISPG and resistance training on (A) hepatic and (B) muscle glycogen level. Data are expressed as the mean ± SEM of 8 mice/group. Different superscript letters (a, b) above the bar are significantly different at p < 0.05. If any letter is the same, it means that the difference between groups is not significant.

