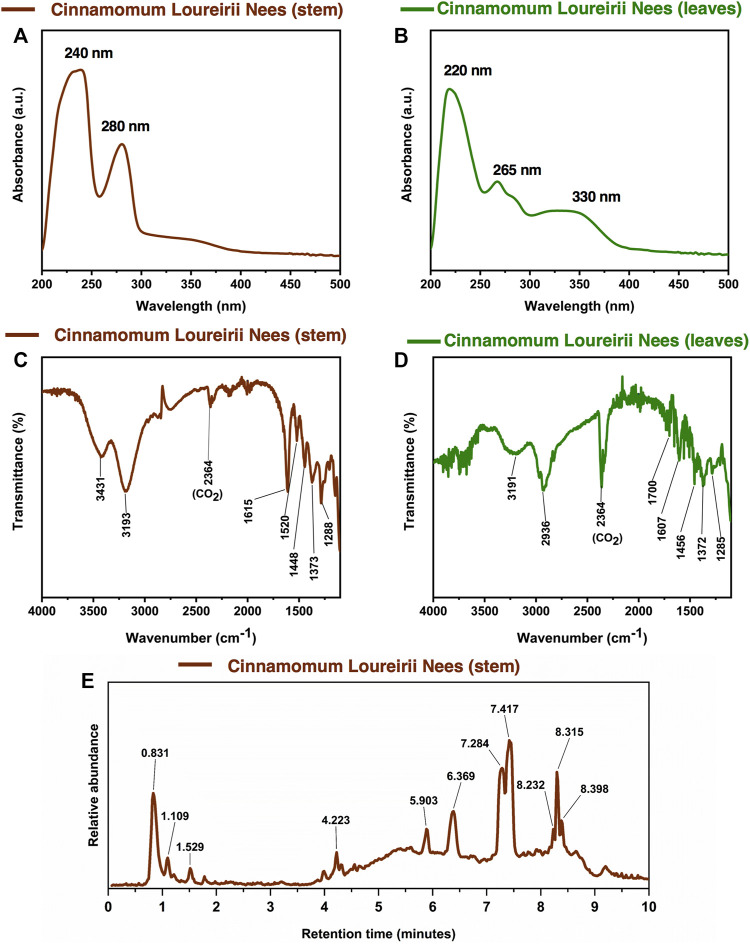
FIGURE 3.
Chemical characterization of Cinnamomum loureirii Nees plant extracts. (A, B) Analysis of UV-Vis absorption spectrum of Cinnamomum stem and leaf extracts, respectively. (C, D) FTIR spectroscopy spectrum of Cinnamomum stem and leaf extracts, respectively. (E) LC-Q-TOF-MS chromatogram for tentatively assigned compounds in Cinnamomum stem extracts.

