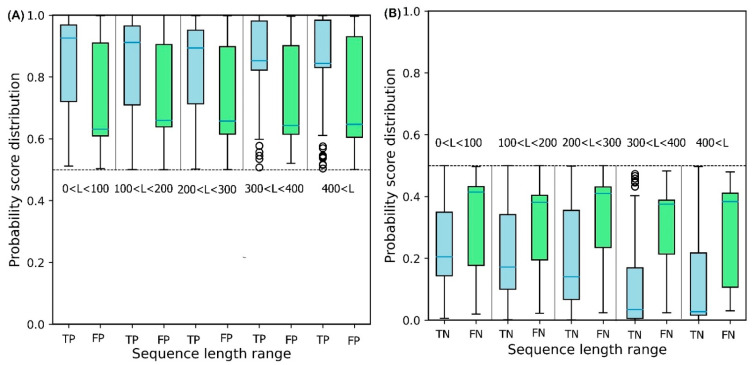
Figure 6.
Probability score distributions for proteins predicted in both test sets to be (A) soluble and (B) insoluble for 5 different sequence length ranges: 0 < L < 100, 100 < L < 200, 200 < L < 300, 300 < L< 400, and 400 < L < . TP = True Positive, FP = False Positive, TN = True Negative, and FN = False Negative. Blue horizontal line in box plot of each set shows the median of the score distribution for that set.

