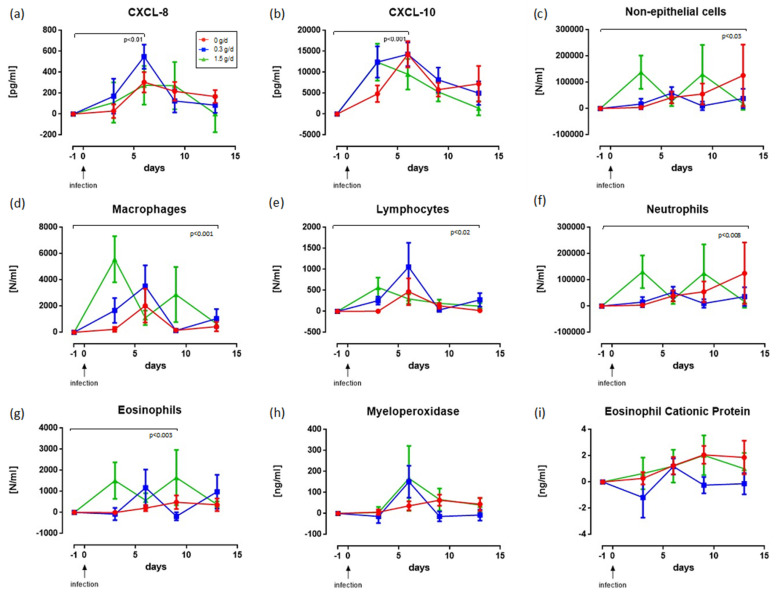
Figure 3.
Time-dependent changes in CXCL-8 (a), CXCL-10 (b), cells in nasal lavage fluid (c–g) and granular proteins (h,i) expressed as change versus value just prior to infection (d-1). Each symbol represents the mean ± SEM. Significance was evaluated by step wise application of the change values of observations per person between d-1 and d13. The reported p-value in the various figures indicates the observed dose-dependent effect over the maximal time after infection for which significance was observed. (a) A dose of 0.3 g/day showed an earlier increase in values than doses of 0 and 1.5 g/day, and a higher peak than a dose of 0. (b) Higher doses led to earlier responses. (c) Higher doses led to higher numbers of cells in a time-dependent (p < 0.03) parabolic fashion. (d) Higher doses led to higher numbers of cells in a time-dependent (p < 0.001) parabolic fashion (e) A dose of 0.3 g/day yielded higher numbers of cells than doses of 0 and 1.5 in a time-dependent (p < 0.002) parabolic fashion. (f) Higher doses led to higher numbers of cells in a time-dependent (p < 0.08) parabolic fashion. (g) Higher doses led to higher numbers of cells in a time-dependent (p < 0.003) parabolic fashion. (h) No significant difference in outcome was found between doses. (i) No significant difference in outcome was observed between doses. The cellular data (panels c–g) above show relatively large standard errors of the mean due to some outliers affecting the mean profiles, especially on d9 and d13. Supplementary Figure S3 shows the same graph with the highest and lowest outliers removed; Supplementary Figure S2 shows the absolute values including the values at baseline (d-55).

