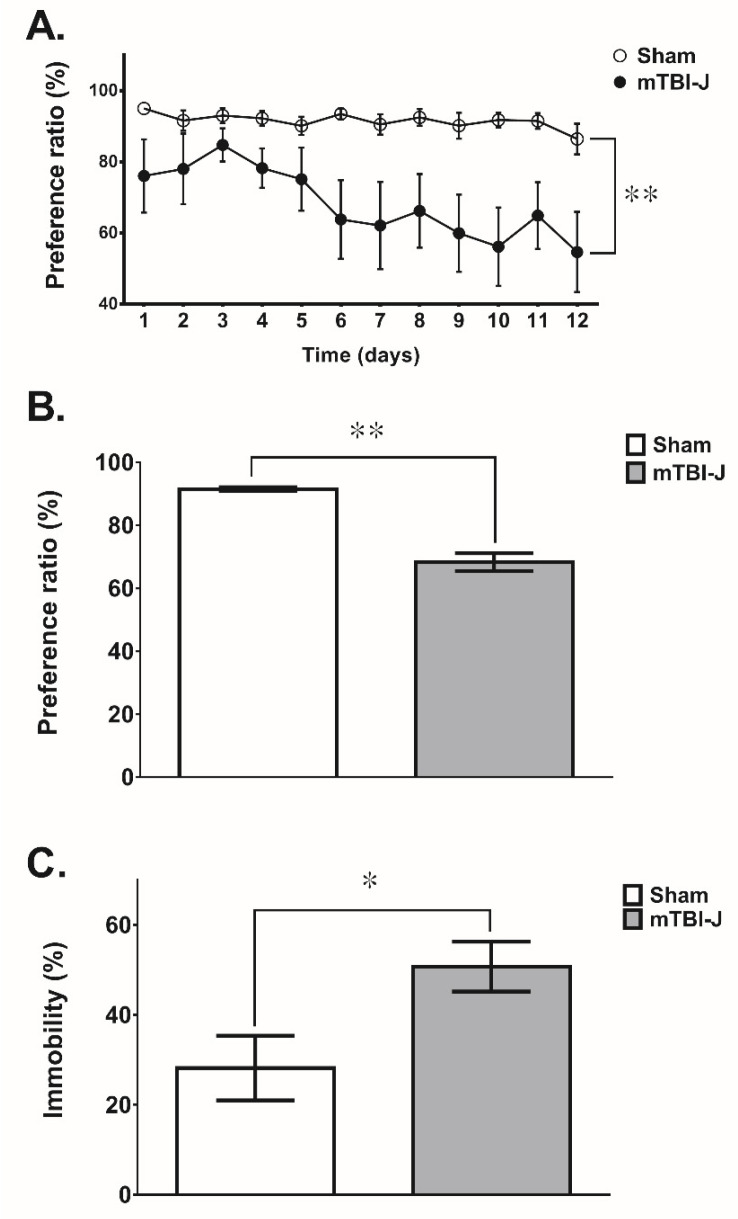
Figure 3.
Examine the depression-like behavior in the mTBI-J rats. (A) The preference ratio of the mTBI-J group in the sucrose preference test was decreased compared with the sham group (two-way ANOVA, p = 0.0079). (B) The average preference ratio was summarized, and a significant difference was found among the mTBI-J and sham control groups. (C) The immobility percentage in the forced swimming test was significantly increased in the mTBI-J animals. Data was presented as a mean ± SEM (* = p < 0.05, ** = p < 0.01).

