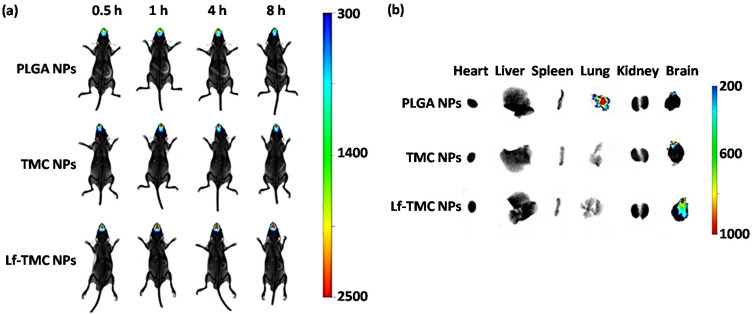
Figure 8.
In vivo and ex vivo fluorescence images of organs of mice. (a) In vivo imaging of mice at 0.5, 1, 4, and 8 h after treatment with DiR-loaded PLGA NPs, TMC NPs, and Lf-TMC NPs at a dose of 0.5 mg DiR/kg of body weight via the intranasal route. (b) Ex vivo imaging of organs excised from mice at 8 h after the intranasal administration. Modified from [185].

