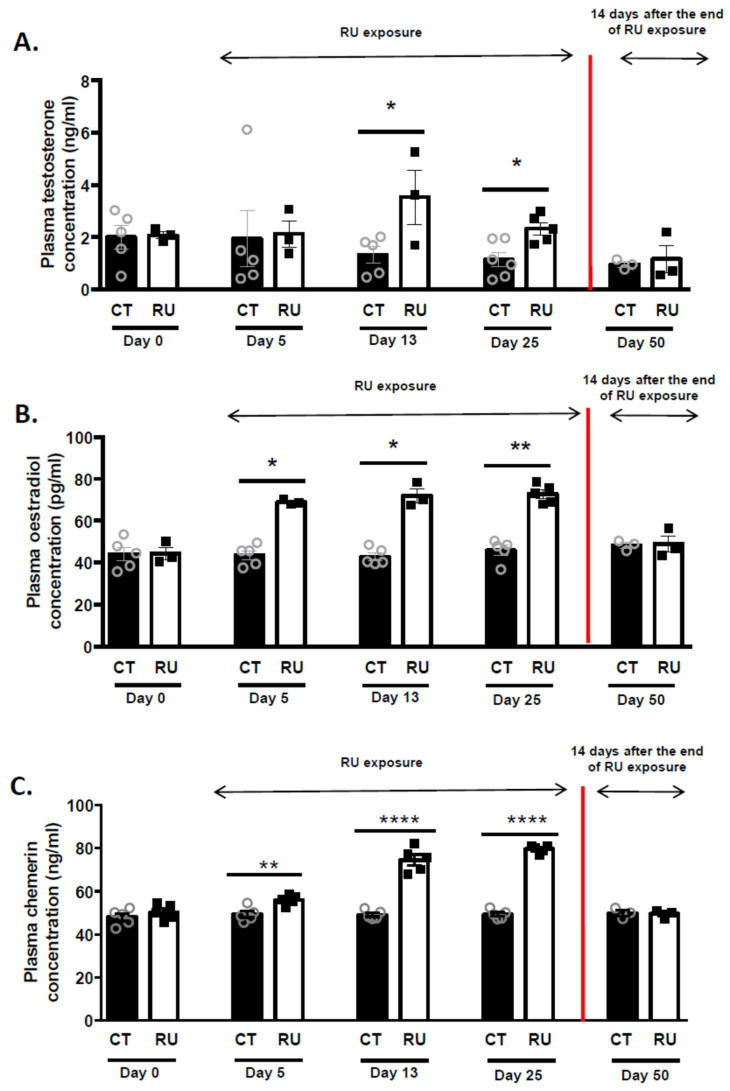
Figure 5.
Plasma testosterone, oestradiol and chemerin concentrations in CT and RU animals. (A) Concentration of blood plasma testosterone (ng/mL). Stars (*) correspond to the unpaired t-test significance (p < 0.05) between CT and RU rooster groups at different times. (B) Concentration of plasma oestradiol (pg/mL). Stars (*) correspond to the unpaired t-test significance (p < 0.05) between CT and RU rooster groups at different times. ** p < 0.01. (C) Concentration of plasma chemerin (ng/mL). Stars (*) correspond to the unpaired t-test significance (p < 0.01) between CT and RU rooster groups at different times. ** p < 0.01; **** p < 0.0001.

