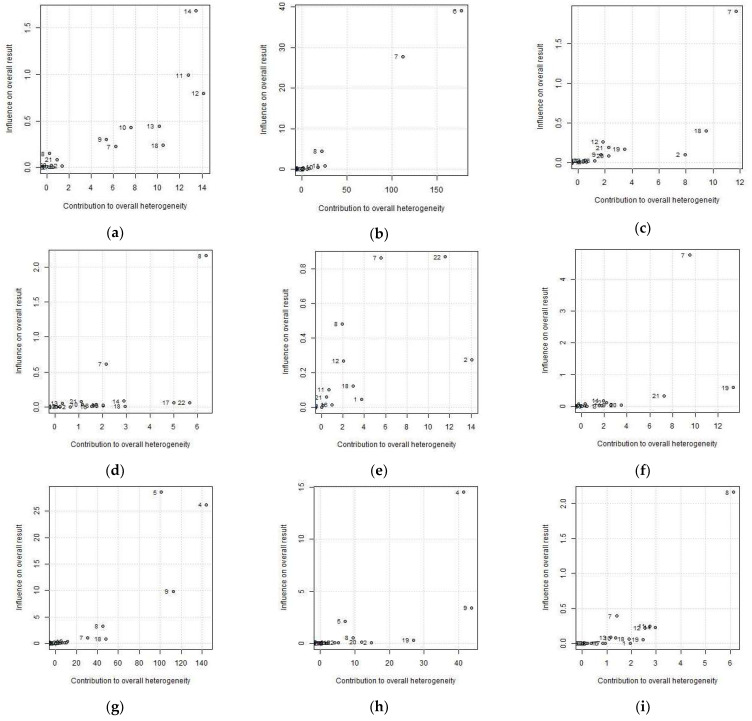
Figure 3.
Baujat plots for (a) waist circumference (WC), (b) body mass index (BMI), (c) total cholesterol (TC), (d) high-density lipoprotein cholesterol (HDL-c), (e) low-density lipoprotein cholesterol (LDL-c), (f) triglycerides (TG), (g) systolic blood pressure (SBP), (h) diastolic blood pressure (DBP), (i) fasting blood glucose (FBG). The number correspond to the items in the ID column of Table 4.

