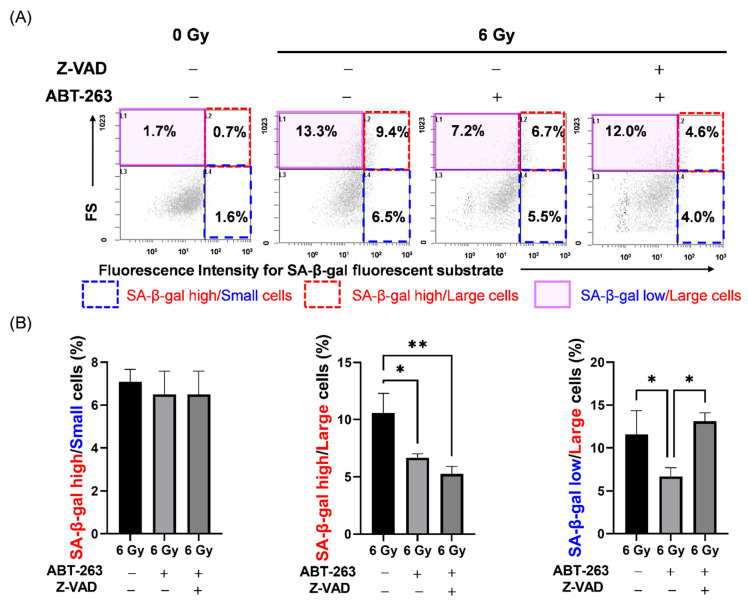
Figure 7.
Effect of the caspase inhibitor Z-VAD on changes in cell populations of irradiated A549 cells by ABT-263. (A,B) A549 cells irradiated at 6 Gy were cultured for 24 h prior to the addition of ABT-263 (5 μM) to the culture. Z-VAD was added to the culture 1 h before ABT-263 administration. After 48 h of culture, SA-β-gal activity and FS, which indicates cell size, were analyzed by flow cytometry. (A) Representative cytograms of FS signals and fluorescence intensities of SA-β-gal are shown. The inset numbers of the cytograms indicate the percentage of SA-β-gal high/FS low (SA-β-gal high/small) cells (blue region), SA-β-gal high/FS high (SA-β-gal high/large) cells (red region), and SA-β-gal low/FS high (SA-β-gal low/large) cells (purple region). (B) The percentages of each population are shown. Data are presented as the mean ± SD of independent experiments. * p < 0.05, ** p < 0.01.

