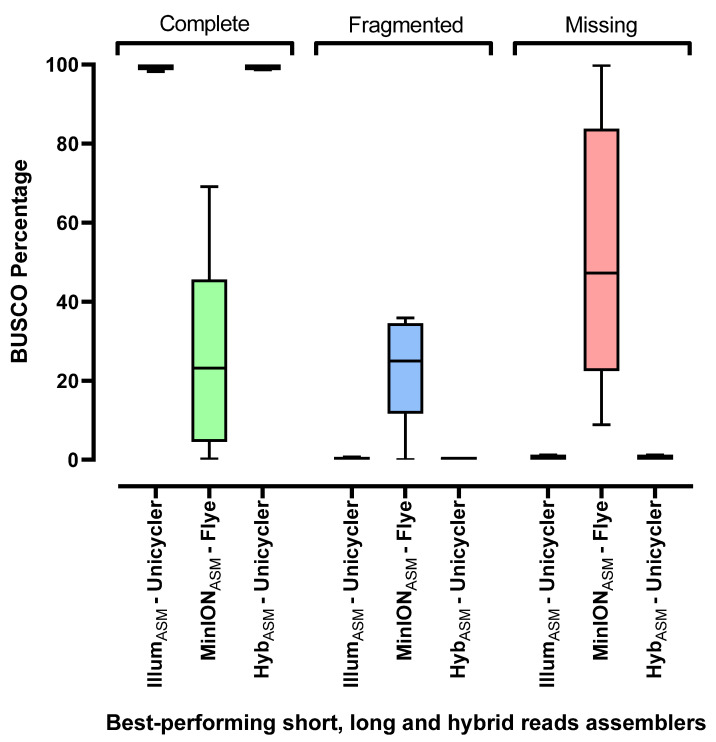
Figure 1.
Box plots for BUSCO results of the best-performing assemblers. IllumASM was produced using Unicycler, MinIONASM using Flye and HybASM was created using Unicycler. Each box extends from Min to Max values in each group and the middle black line in each box indicates the mean value. The BUSCO percentage for mixed samples is not included in the graph.

