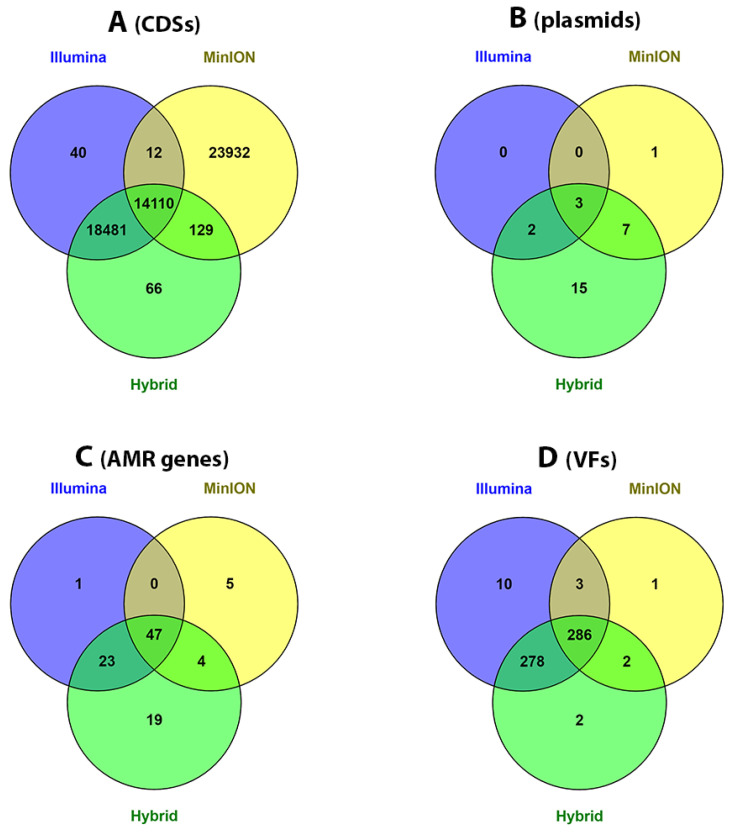
Figure 3.
An overview of downstream analysis results for different assemblies created using the top-performing assemblers. Venn diagrams prepared using the Venny online platform to plot differences in the number of annotations obtained, in which data for four E. coli and five K. pneumoniae isolates were merged. Numbers in the overlap area indicate the mutual hit names (hits identified in the exact same isolates). (A) The number of annotated CDSs (putative and hypothetical proteins not plotted). (B) The number of identified and confirmed plasmid contigs using PlasmidFinder and Bandage visualization tools, respectively. (C) The number of AMR genes, including both acquired and point mutations. (D) The number of identified VFs.

