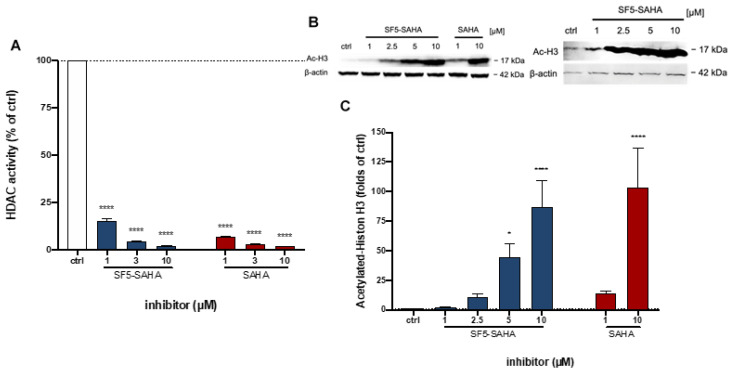
Figure 5.
HDAC inhibitory effects of SF5-SAHA in cancer cells. (A) HDAC activity was measured by luminescence display of the acetylation state of histones. HeLa nuclear cell extracts, used as source for histones, where preincubated with substrate and inhibitor. Results are given as relatives to controls, not preincubated with inhibitor, as means ± SEM of n = 3 independent experiment. (B) Representative Western blot out of n = 3 experiments, showing changes in the expression of acetylated histone H3 after 24 h treatment with compounds in DU145 (left) and Hep-G2 (right) cells. (C) From the Western blots gray intensity, mean ± SEM, of acetylated histone H3 specific bands where quantified adjusted to protein loading and normalized to untreated control. * p ≤ 0.05, **** p ≤ 0.0001; 2-way ANOVA Dunnett’s post-hoc test.

