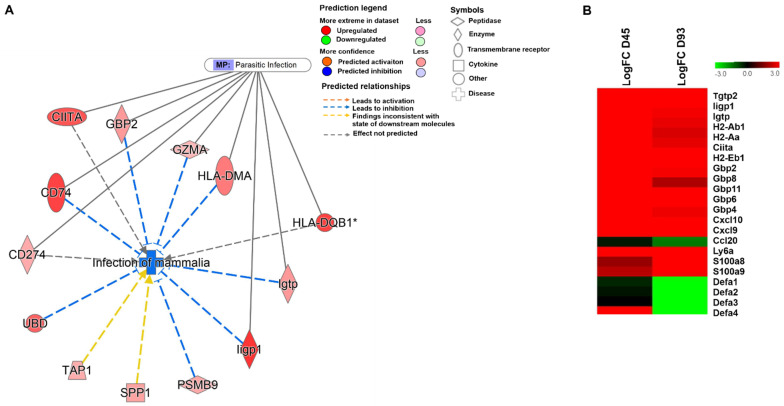
Figure 3.
Analysis of molecules regulated during C. parvum infection. (A) Molecular network representing genes involved in mammalian infection overlaid with the function of parasitic infection. (*) Indicates that multiple identifiers are present in the dataset file which map to a single gene in the global molecular network. (B) Heatmap of genes significantly upregulated or downregulated in infected caecum tissue compared to uninfected tissue at days 45 and 93 PI.

