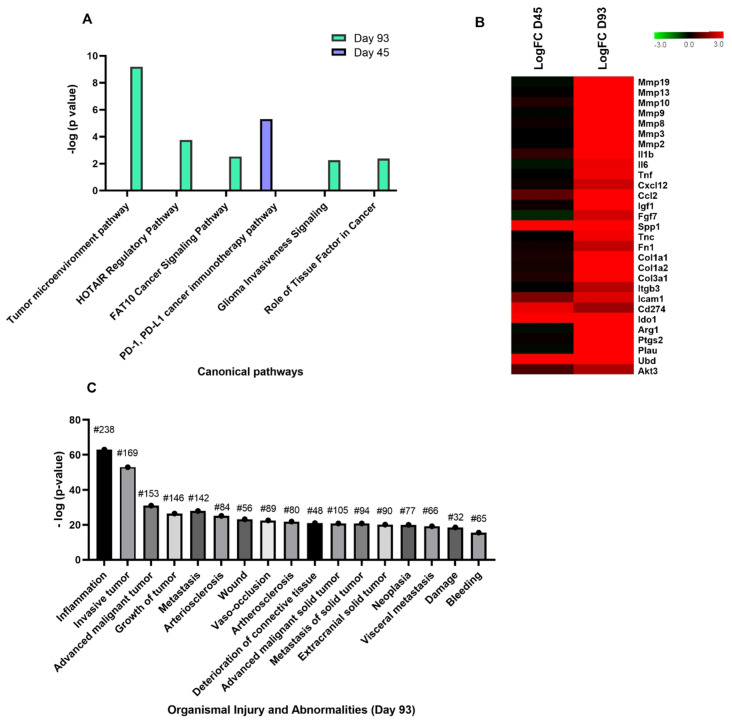
Figure 5.
IPA analysis of tumor microenvironment induced by C. parvum infection. (A) Cancer related canonical pathways observed at days 45 and 93 PI are represented in terms of -log (p-value) on y-axis. (B) Heatmap of genes identified in tumor microenvironment canonical pathway at days 45 and 93 PI. (C) Cancer-related functions associated with “Disease/Disorder—Organismal Injury and Abnormalities” are represented in terms of −log (p-value) on y-axis. # = no. of differentially expressed genes.

