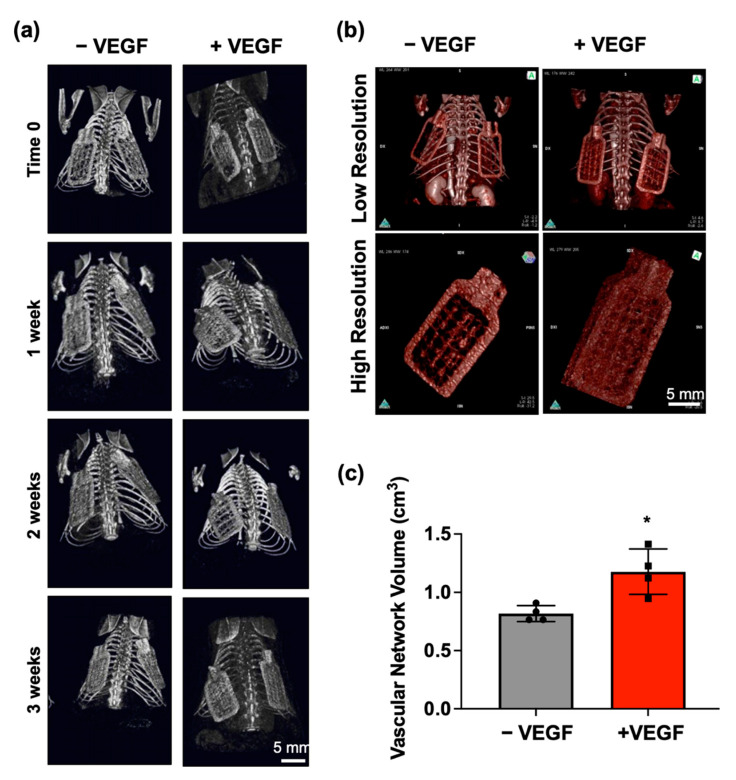
Figure 2.
In vivo monitoring of device movement and evaluation of angiogenesis at 4 weeks. (a) Weekly representative micro-CT images enabling visualisation of implanted −VEGF and +VEGF macroencapsulation devices to accurately monitor movement over the 4-week period. (b) Representative images of Iopamiro® 370 stained −VEGF and +VEGF devices were captured at both low (FOV73 camera) and high resolutions (FOV40 camera). (c) Mean volumes of surrounding vascular network estimated using the OsiriX lite program. n = 4 per group, data are represented as means ± SD, * p < 0.05.

