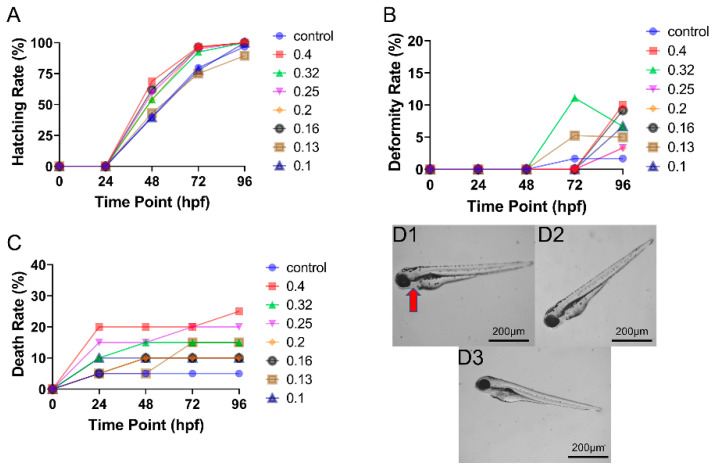
Figure 2.
Concentration- and time-dependent effects of ENF on zebrafish embryo development (n = 60). (A) Time–response curves for hatching rate at all tested doses. (B) Time–response curves of deformity rate at all tested doses. (C) Time–response curves of death rate at all tested doses. (D) Typical deformities induced by (D1) 0.40 mg/L, (D2) 0.20 mg/L, and (D3) 0.10 mg/L ENF at 96 hpf. Red arrow indicates a region of pericardial oedema.

