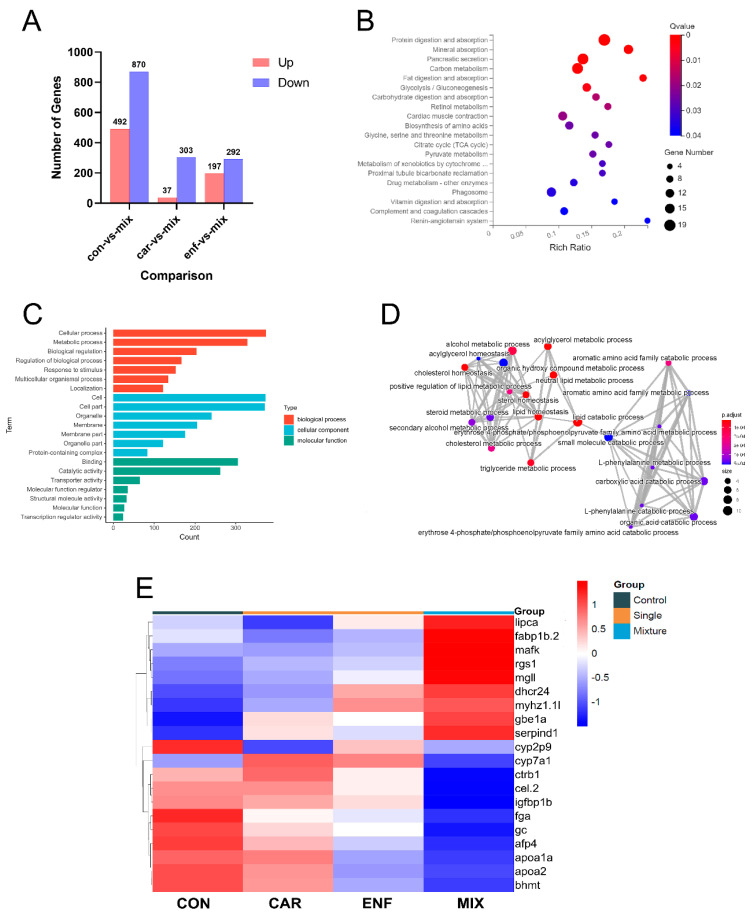
Figure 5.
Transcriptomic results indicate that DEGs among treatment groups are enriched in genes required for nutrient metabolism. (A) DEGs for controls vs. MIX, CAR vs. MIX, and ENF vs. MIX at 96 hpf. (B) KEGG pathway enrichment of DEGs. The y-axis represents the significantly enriched KEGG pathways and the x-axis denotes the enrichment factor of DEGs. (C) GO category pattern of DEGs in 96 hpf larvae. (D) GO network of DEGs. (E) Heat map of top DEGs.

