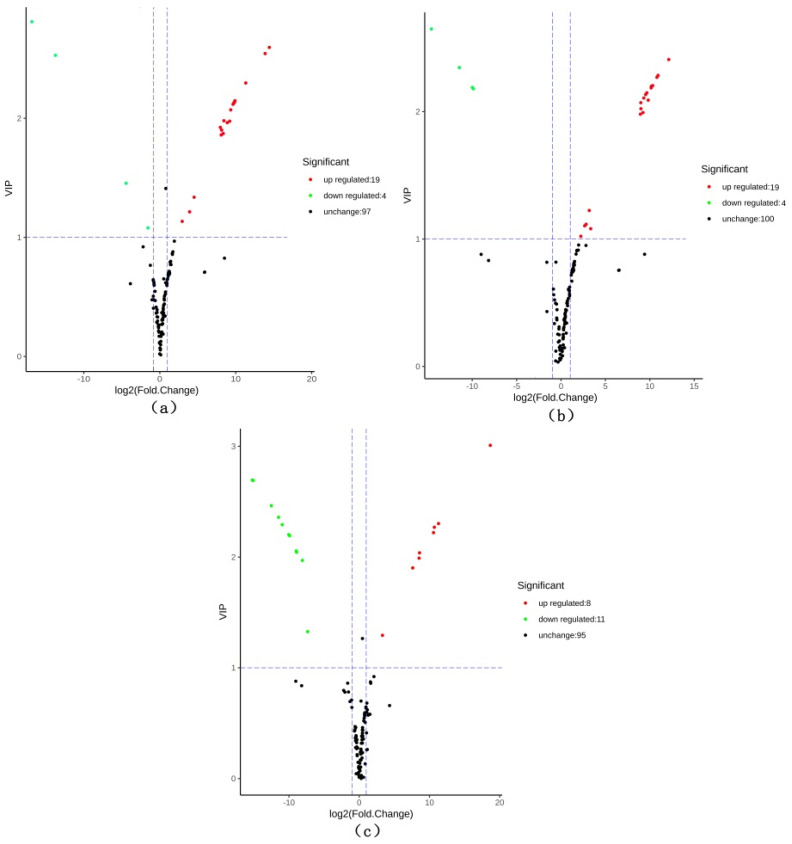
Figure 5.
Volcano maps of differential metabolites. (a) CSG vs. CHG; (b) CSG vs. CFG; and (c) CFG vs. CHG. Each dot represents a metabolite; the horizontal axis represents the log of the difference of a metabolite in the two samples, log2(fold change). The vertical axis represents the importance of the variable (VIP). The larger the absolute value of the abscissa, the more significant the difference is, which results in screening of the target differential metabolites. The green dots indicate that the differential metabolite was downregulated, the red dots indicate that the differential metabolite was upregulated, and the black dots indicate that the differential metabolite was not significantly changed.

