Figure 8.
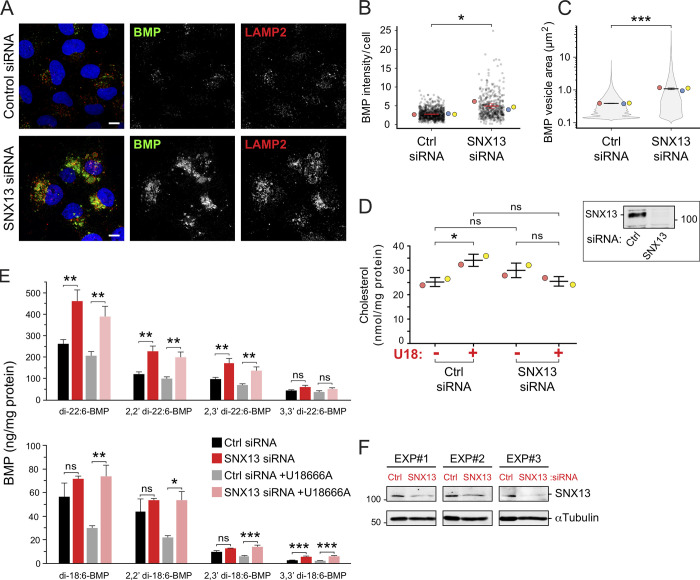
SNX13 depletion in NPC1 WT U2OS cells increases BMP. (A) U2OS cells labeled with anti-BMP and anti-LAMP2 antibodies 72 h after transfection with the indicated siRNAs. Scale bar, 10 µm. (B and C) Quantitation of BMP-positive vesicle area (B) and total BMP intensity (C) per cell. Colored dots represent means from independent experiments; >480 cells analyzed in each condition. Significance was determined by unpaired t test; *, P < 0.05; ***, P < 0.001. (D) Total cell cholesterol in cells treated as in A. Samples were treated with cholesterol esterase before assay to cleave cholesterol esters. Colored dots reflect means from independent experiments. Significance was determined by uncorrected Dunn's test with Kruskal-Wallis one-way ANOVA; *, P < 0.05. Immunoblot at right shows endogenous SNX13 levels from the experiments in D. (E) MS determination of BMP isoforms normalized to protein content from cells treated as indicated. Data from three independent experiments (mean ± SEM). Significance was determined by two-way ANOVA with Tukey’s post hoc test; *, P < 0.05; **, P < 0.01; ***, P < 0.001. (F) Immunoblot of the experiments in E; 50 µg of cell extract was analyzed. P values: (B) Ctrl siRNA versus SNX13 siRNA, P = 0.0171; (C) Ctrl siRNA versus SNX13 siRNA, P = 0.000305; (D) Ctrl siRNA without U18 versus Ctrl siRNA with U18, P = 0.025; Ctrl siRNA without U18 versus SNX13 siRNA without U18, P = 0.153; SNX13 siRNA without U18 versus SNX13 siRNA with U18, P = 0.31; Ctrl siRNA with U18 versus SNX13 siRNA with U18, P = 0.066; (E) top: di-22:6-BMP, P = 0.0024 and 0.0038; 2,2′ di-22:6-BMP, P = 0.0018 and 0.0026; 2,3′ di-22:6-BMP, P = 0.0025 and 0.004; 3,3′ di-22:6-BMP, P = 0.0812 and 0.157; (E) bottom: di-18:1-BMP, P = 0.247 and 0.0038; 2,2′ di-18:1-BMP, P = 0.517 and 0.011; 2,3′ di-18:1-BMP, P = 0.0948 and 0.0008; 3,3′ di-18:1-BMP, P = 0.0005 and 0.0001.

