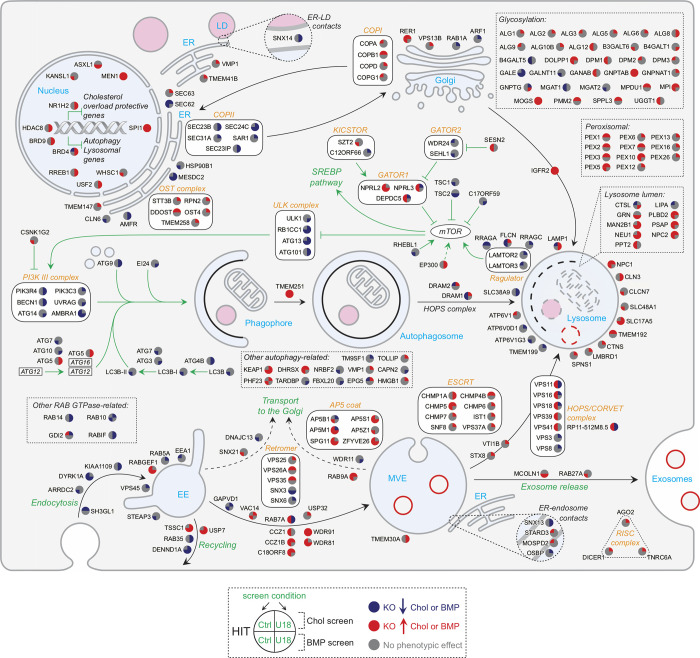
Figure S2.
Subcellular localization of screen hits and their phenotypes. Selected top hits are annotated in colored circles that show increases (red) or decreases (blue) in cholesterol (Chol). Upper left, BMP; lower left, cholesterol with U18666A (upper right) or BMP with U18666A (lower right) as indicated in the legend at the bottom. Black arrows indicate trafficking routes. Green arrows indicate activation; inhibition signs are also displayed in green. COP, coat proteins; EE, early endosome; KO, knockout; LE, late endosome.

