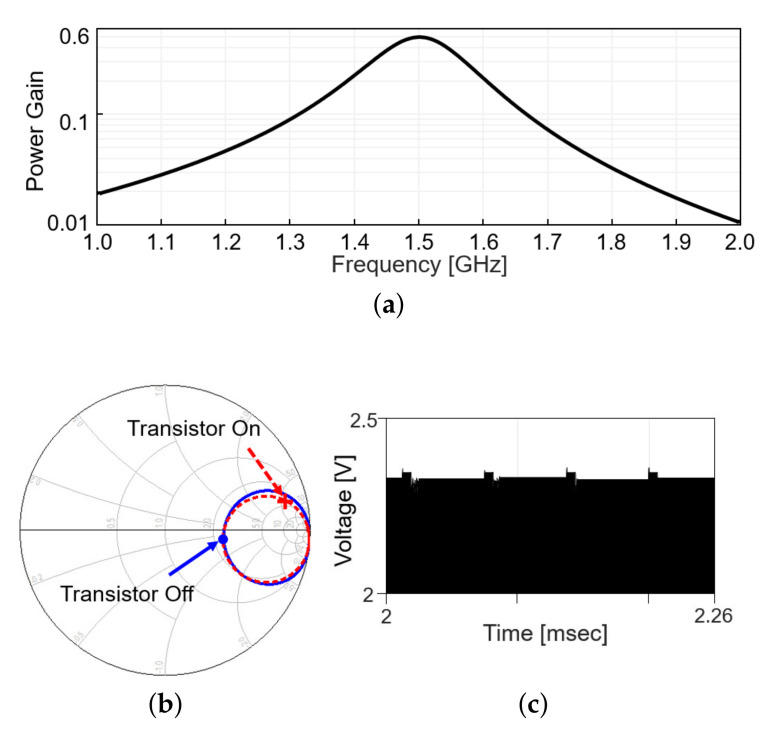
Figure 4.
Wireless link analysis in simulation. (a) Power gain plot is obtained by simulation that includes a s2p file modeling the coupling between Tx and Rx coil and matching networks. (b) Smith chart for at the transmitter with the frequency range from 1 to 2 GHz. (c) Backscattered signal in time domain.

