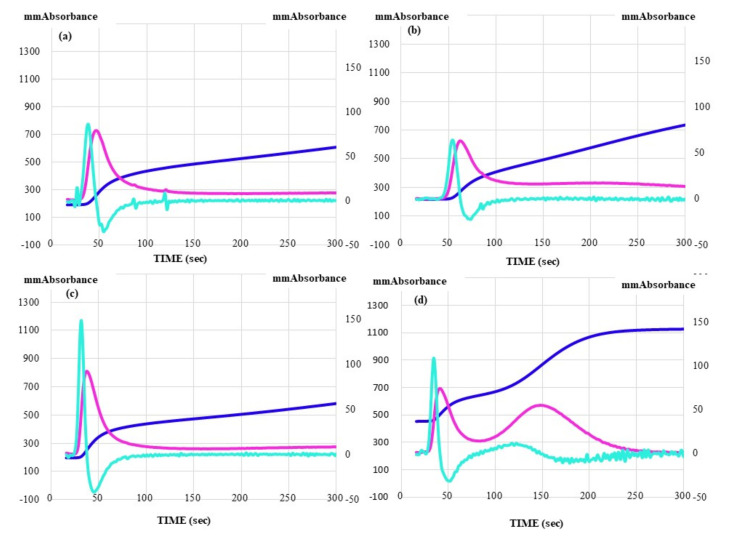
Figure 4.
CWA-TT in PPP (a,c) and PRP (b,d) in patients with ITP (a,b) or MDS (c,d). CWA, clot waveform analysis; TT, thrombin time; PPP, platelet-poor plasma; PRP, platelet-rich plasma; ITP, idiopathic thrombocytopenic purpura; MDS, myelodysplastic syndrome; navy line, fibrin formation curve; red line, 1st derivative curve (velocity); light blue, 2nd derivative curve (acceleration).

