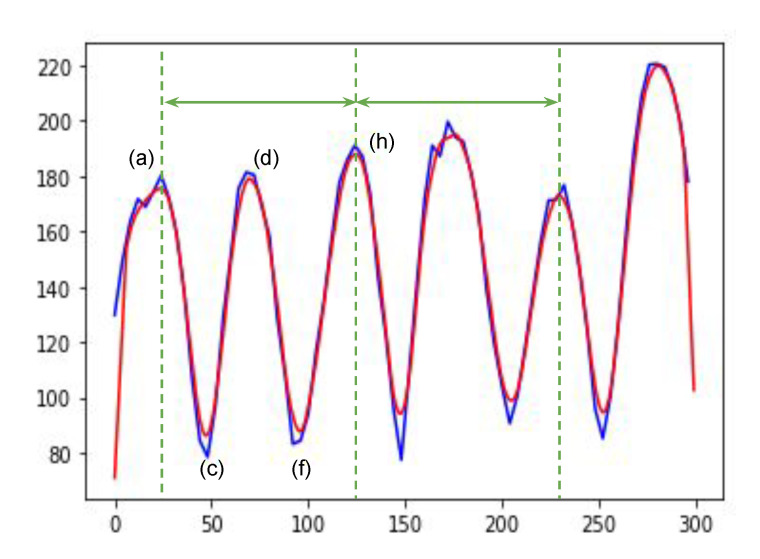
Figure 6.
Gait cycle extraction in a sample of . One gait cycle (green solid line arrows) is from the changes in the distance of two ankles. To remove a subtle change in these ankle distances, data smoothing is applied. The line in blue is raw data. The line in red is after smoothing. The x-axis is for the image frame numbers. The y-axis is for the 3D distances between the two joints.

