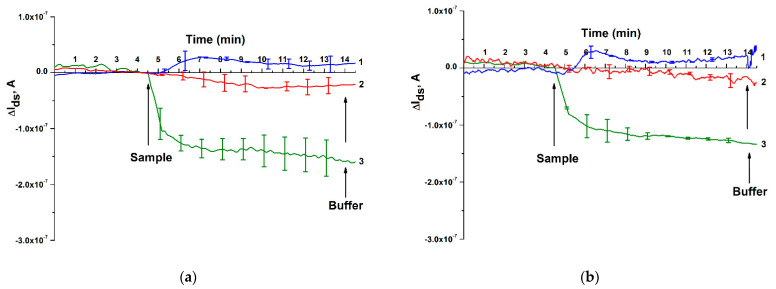
Figure 7.
Detection of miRNA isolated from blood plasma using NRBS. (a) Results obtained on the first day of the study. (b) Results obtained on the second day of the study. Legend: curve 1—control sample of miRNA isolated from blood plasma of a conditionally healthy patient diagnosed with urolithiasis (non-oncological); curve 2—control sample of miRNA isolated from the blood plasma of a patient with adenocarcinoma of the prostate; curve 3—miRNA-17-3p sample isolated from blood plasma of a patient diagnosed with colorectal cancer. Number of technical replicates is n = 3. Arrows indicate the addition of miRNA solutions and 1 mM potassium phosphate wash buffer.

