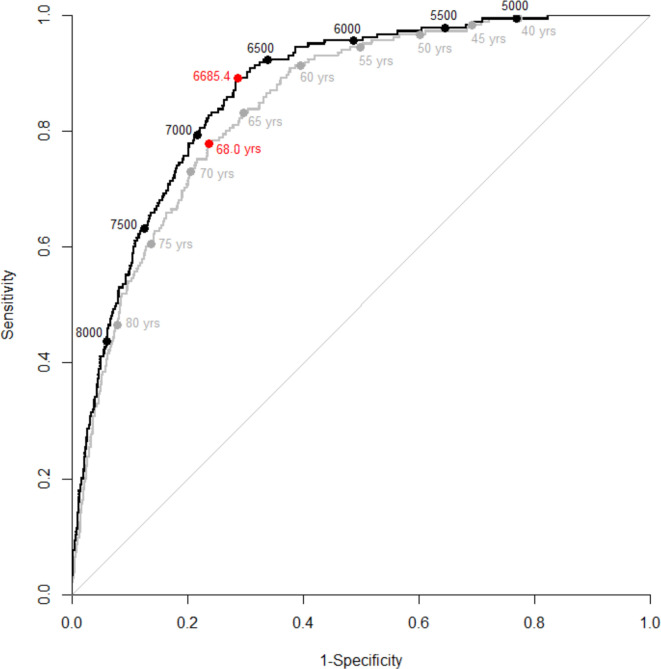
Figure 1.
Receiver operating characteristic (ROC) curves demonstrating the performance of two models to predict COVID-19-related deaths among individuals with laboratory confirmed SARS-CoV-2 infection (n=3867) from southeast Michigan and the Detroit metropolitan area. The black line denotes the 14-variable prediction model with black circles representing risk score thresholds. The grey line denotes the age-only prediction model with grey circles representing age thresholds. Red circles represent the Youden index (ie, the point that maximises Sensitivity +Specificity – 1). The area under the curve (AUC) for the 14-variable ROC curve was 0.868 (0.846–0.891), and the AUC for the age-only ROC curve was 0.846 (0.821–0.871).

