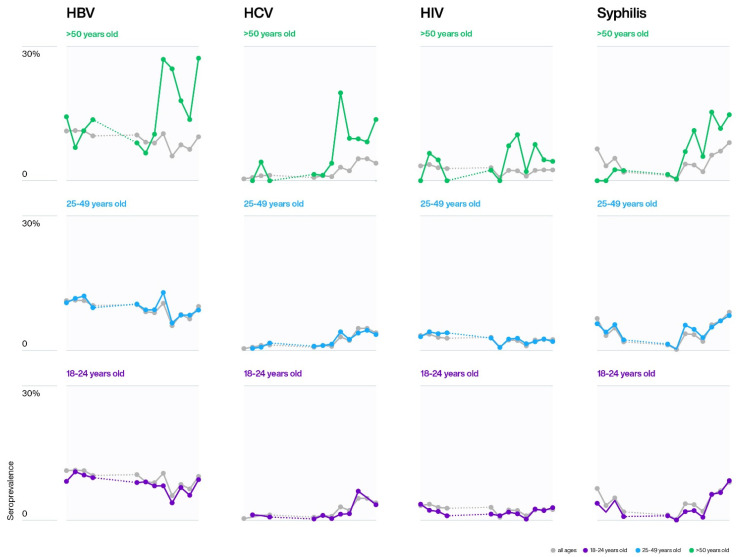
Figure 4.
The TTI seroprevalences for the age groups: 18–24 (purple), 25–49 (blue), >50 (green) were compared with the annual average (grey). Dotted lines (…..) correspond to the time period 2009 to 2012, when no blood donor data was available. The Chi-square test showed significant (p <0.0001) higher prevalences in the age group >50 when compared to the other two age groups.

