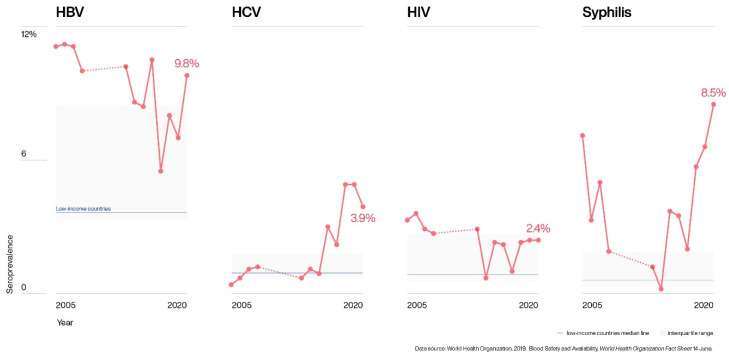
Figure 5.
Representation of the variation of transfusion-transmitted infections over the study period, compared with the seroprevalence median of blood donors established by the WHO for low-income countries [33]. Dotted lines (…..) correspond to the time period 2009 to 2012, when no blood donor data was available.

