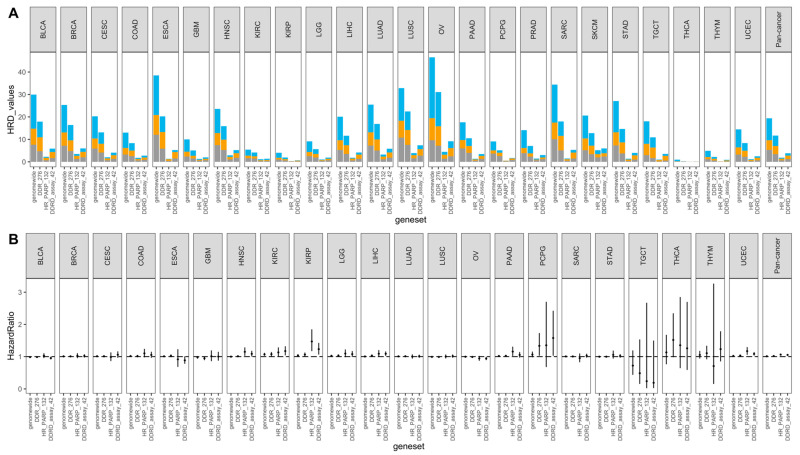
Figure 1.
The distribution of HRD scores defined by different genesets were varied in relation to their prognostic prediction. (A) Stacked bar plot for the distribution of HRD scores. Total scores were the sum of HRD-LOH (gray), HRD-TAI (orange), and HRD-LST (blue) across the different genesets for 24 individual cancer types and pan-cancer. (B) Forest plots of the association between the HRD score and overall survival. Results are shown for 24 cancer types and pan-cancer with valid outcomes data. Hazard ratios and 95% confidence intervals are shown by the dot and the line, respectively. HRD: homologous recombination deficiency; LOH: loss of heterozygosity; TAI: telomeric allelic imbalance; LST: large-scale state transitions.

