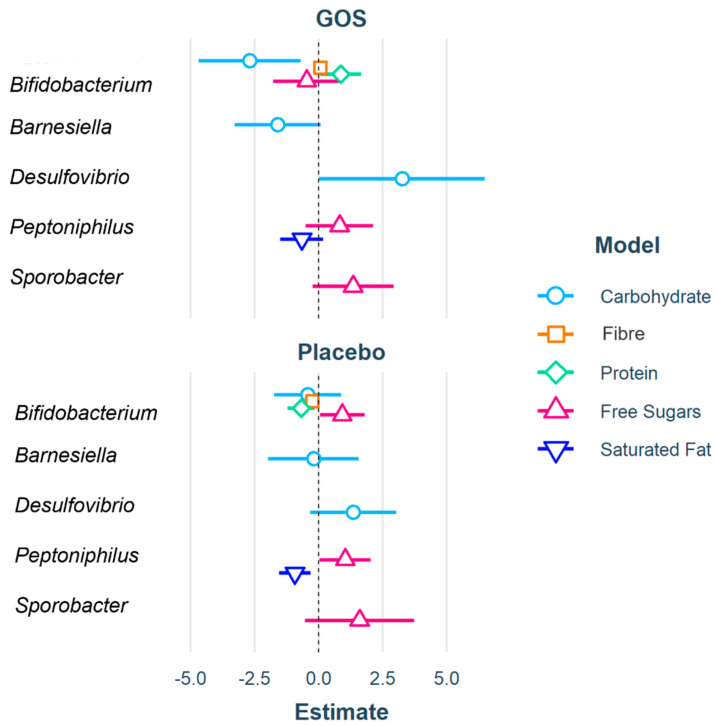
Figure 2.
Coefficients from significant stepwise regressions for each nutrient model (carbohydrate, fibre, protein, free sugars, and saturated fat), represented by different colors and point shapes. Only genera which had a significant contribution on model outcomes are plotted. Treatment groups (GOS and Placebo) are plotted separately for ease of viewing. The further the data point from central zero the larger the coefficient and strength of effect. Data points to the left of zero are negative coefficients, illustrating a negative relationship of the predictor to nutrient outcome, and data point to the right are positive coefficients, representing a positive relationship. In the carbohydrate model (blue), GOS Bifidobacterium and Desulfovibrio are significant coefficients. In the Fibre model (orange), placebo Bifidobacterium is a significant coefficient. The Protein model (green) found GOS Bifidobacterium a positive significant coefficient and placebo Bifidobacterium a negative significant coefficient. The free sugar model (pink) found placebo Bifidobacterium and Peptoniphilus to be significant coefficients and in the saturated fat model (dark blue) placebo Peptoniphilus a negative significant coefficient.

