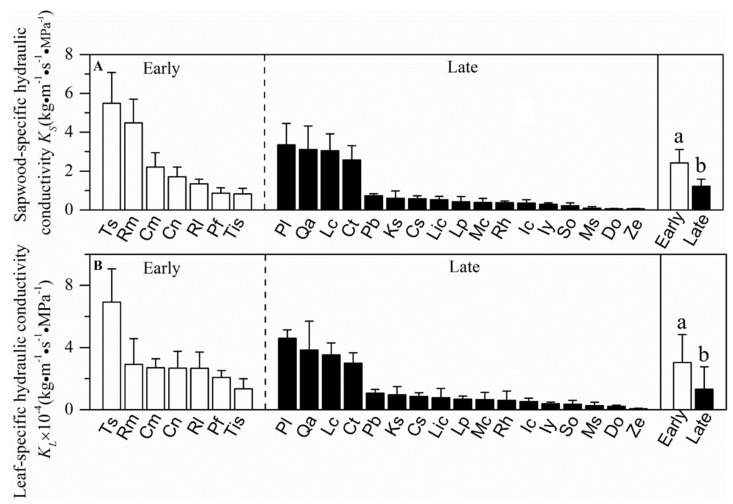
Figure 3.
Mean values (±SE) of sapwood-specific hydraulic conductance (KS) and leaf-specific hydraulic conductance (KL) for 24 wood species in two successional communities. White and black bars represent species from the early- and late-succession stages, respectively. Different letters at the top of each column denote significant differences among communities (p < 0.05).

