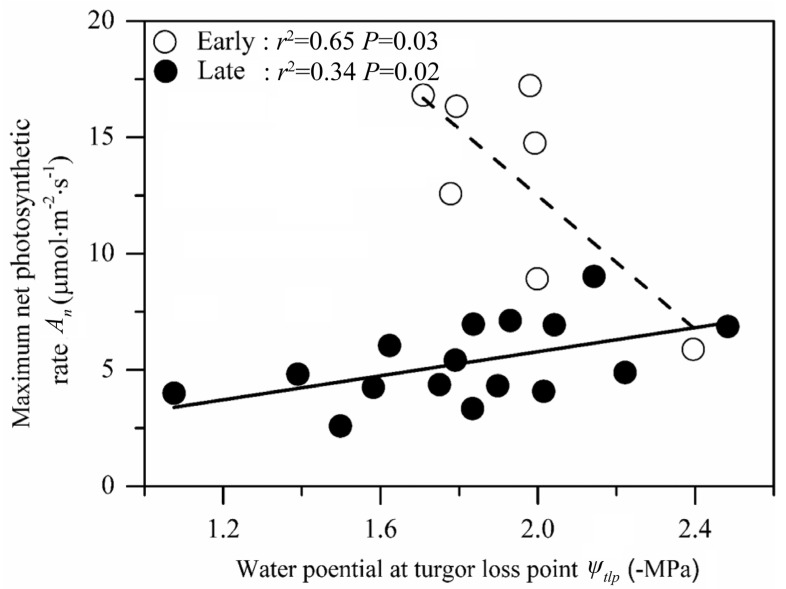
Figure 7.
Relationship between maximum net photosynthetic rate (An) and water potential at turgor loss point (ψtlp). The white circles and the dashed line represent species in the early-successional stage, while the black circles and the solid line represent species in the late-successional stage. Both show a significant relationship (p < 0.05).

