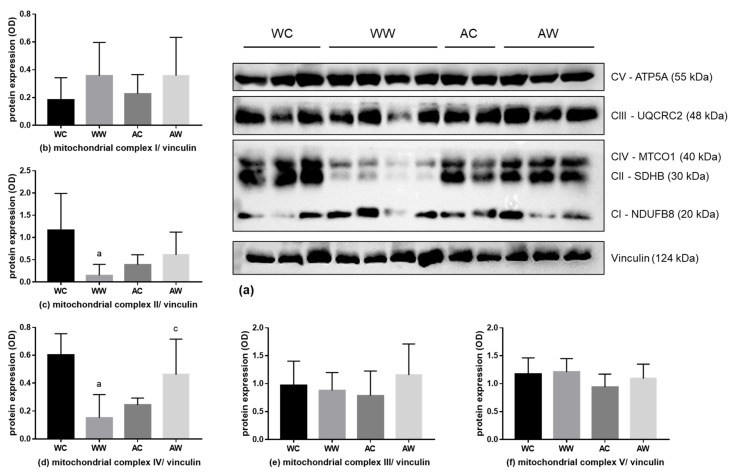
Figure 4.
Liver protein expression of the mitochondrial respiratory complex. (a) Western blot images are a representative image of the mitochondrial respiratory complexes and the loading control vinculin of the total analysis of all animals in each group. Analyses of the protein expression of mitochondrial respiratory complexes; the subunits protein expression are presented in (b) V subunit; (c) III subunit; (d) IV subunit; (e) II subunit; and (f) I subunit. For subunit details, please see the Material and Methods section. Legend: WC, weanling control group (n = 7); WW, weanling tumour-bearing group (n = 10); AC, adult control group (n = 6); AW, adult tumour-bearing group (n = 8). Data were expressed as mean ± standard deviation (SD). The units used were protein/vinculin protein expression (optical density, OD—western blot image). Data were analysed by two-way ANOVA and corrected for multiple comparisons by the post hoc test Bonferroni. a represents differences from the WC group and c indicates differences from the WW group. Differences were significant when p < 0.05.

