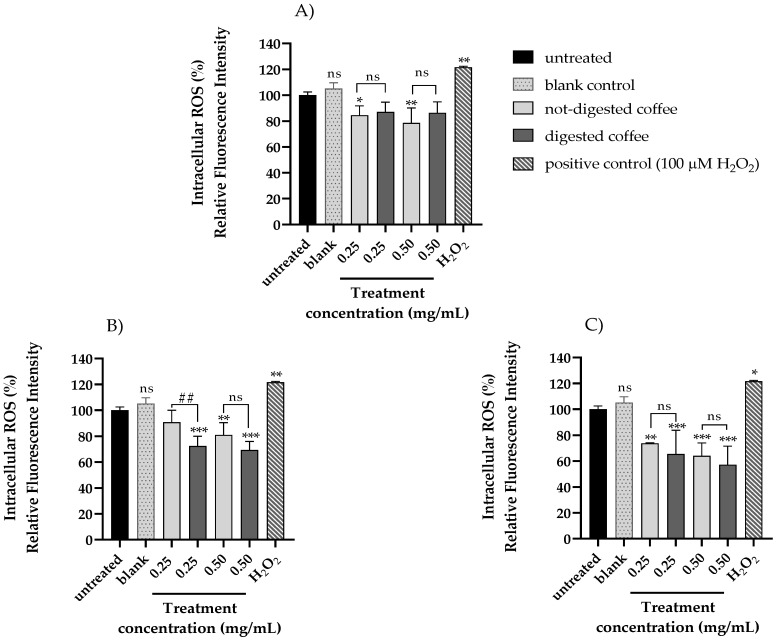
Figure 2.
Evaluation of intracellular ROS level in HT-29 cells treated with not-digested or digested coffee samples. Intracellular ROS level was assessed by H2DCF-DA assay on HT-29 cells treated for 24 h (A), 48 h (B), and 72 h (C) with different concentrations of digested and not-digested coffee samples (0.25 and 0.5 mg/mL) and with vehicle (blank control) resulting from in vitro digestion related to untreated cells. Cells treated with 100 µM H2O2 were used as positive control. Mean ± SD of three independent experiments were plotted on the graph. Differences were considered significant when p-value ≤ 0.05 and p-value ≤ 0.01 and highly significant when p-value ≤ 0.001. * p ≤ 0.05, ** p ≤ 0.01, and *** p ≤ 0.001 versus untreated control (calculated as fold-change relative to untreated cells, arbitrarily set at 100%); ## p ≤ 0.01 not-digested coffee versus digested coffee. No significant differences were observed between blank control and untreated cells at 24 h, 48 h, and 72 h. ns: not statistically significant.

