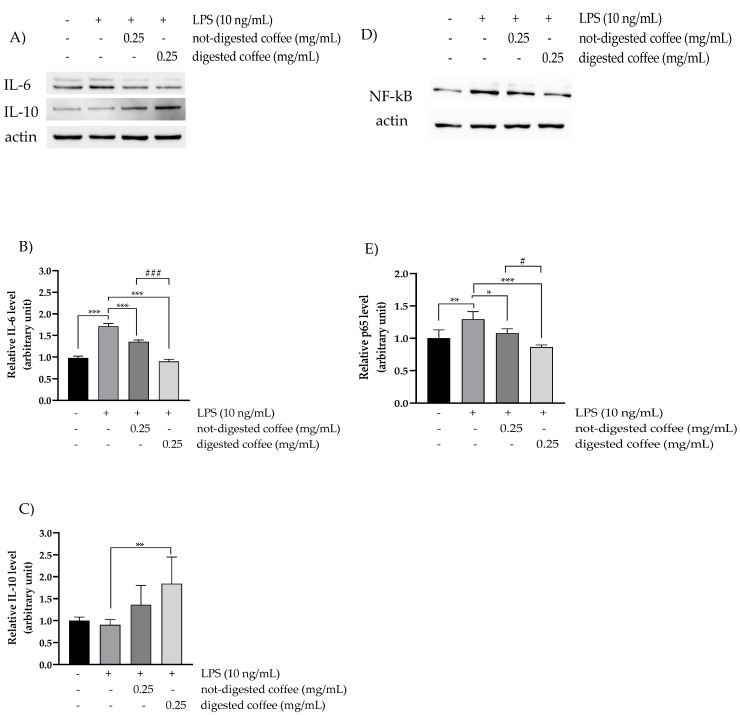
Figure 3.
Anti-inflammatory effects of digested coffee samples in LPS-stimulated HT-29 cells. Western blot analysis of the expression levels of interleukin-6 (IL-6) (A), interleukin-10 (IL-10) (A), and NF-kB (p65 subunit) (D) in total cell lysates from untreated control and LPS-stimulated HT-29 cells treated for 48 h with not-digested coffee or digested coffee samples loading. (B,C,E) Densitometric analysis of Western blots. Band intensities were quantified and normalized to actin used as control. All data were analyzed for statistical significance by two-way ANOVA, followed by Dunnett’s multiple comparison test where appropriate. Differences were considered significant when p-value ≤ 0.05 and p-value ≤ 0.01 and highly significant when p-value ≤ 0.001. * p ≤ 0.05, ** p ≤ 0.01, and *** p ≤ 0.001 versus untreated control (calculated as fold-change relative to untreated cells, arbitrarily set at 1); # p ≤ 0.05, and ### p ≤ 0.001 not-digested coffee versus digested coffee. Differences were considered significant when p-value ≤ 0.05 and highly significant when p-value ≤ 0.0001. * p-value ≤ 0.05, ** p-value ≤ 0.0001 versus LPS-stimulated control; # p-value ≤ 0.05, ### p ≤ 0.001 not-digested coffee versus digested coffee.

