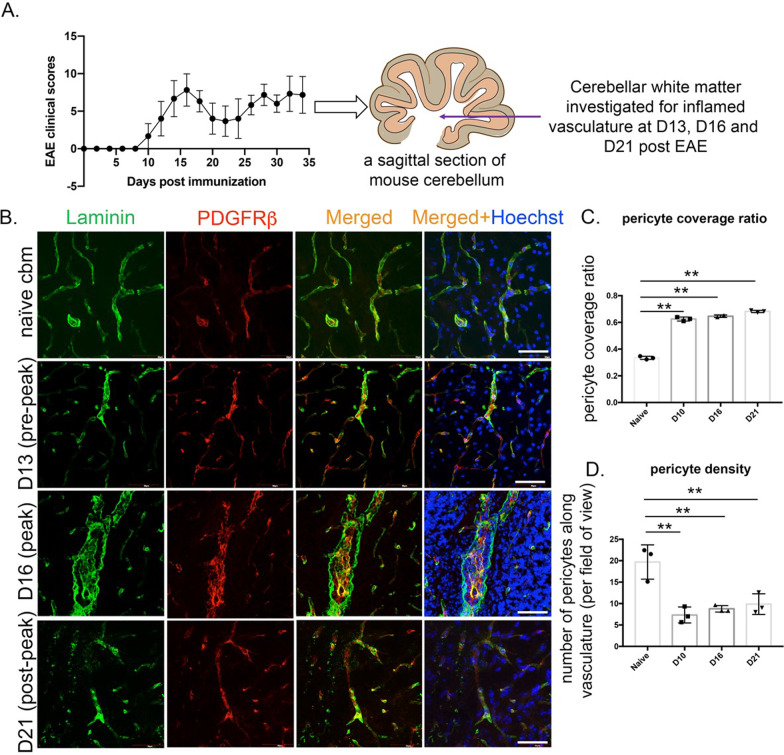
Fig. 1.
Pericyte heterogeneity in EAE pathology. A The graph represents clinical scores of the three EAE mice that were investigated for this study. The cartoon shows white matter within the cerebellum sagittal sections studied for pericytes. B Confocal images of capillary basement membranes delineated with anti-laminin antibodies exhibit PDGFRβ+ pericytes encased within laminin+ basement membranes in pre-peak (D13), peak (D16) and post-peak (D21) EAE cerebellum. Scale 50 µm. C Pericyte coverage ratio as described by the total length of pericytes along the vasculature shows increase in each of the EAE time points observed as compared to the naïve cerebellar pericytes. D Pericyte density as studied by the nucleated pericytes abutting the length of the vasculature in the given field and represented as number of cells per field of view. Scale 100 µm. Datasets are expressed as mean ± SD. **p < 0.01

