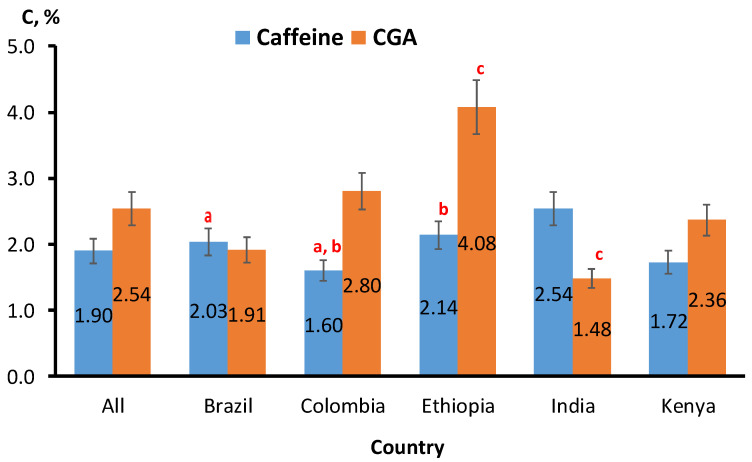
Figure 1.
The caffeine and CGA content (C, %) in coffee beans from different geographical origin (different roasting degrees). More details concerning the number of samples for each origin are available in the Supplementary Table S1. Bars labeled by the letters a,b,c are statistically significant (p < 0.05).

