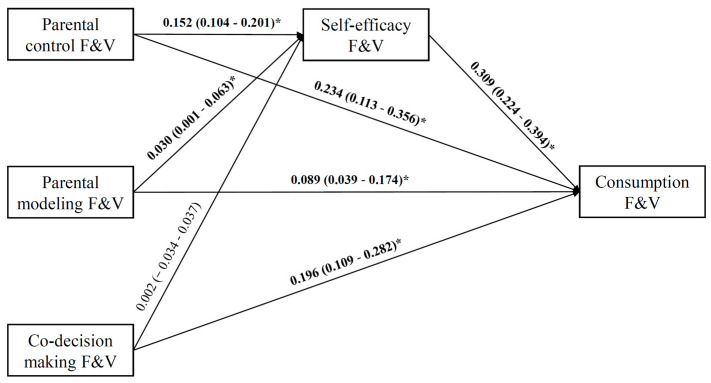
Figure 2.
Path model of adolescents’ fruit and vegetable (F&V) consumption, adjusted for adjusted for age, gender, adolescents’ educational level, parental education level, monthly house-hold income, perceived health status, perceived weight status, perceived peer influence, BMI, and physical activity. β-coefficient and 95% CI are in parentheses. Significant results are bolded. * p < 0.05.

