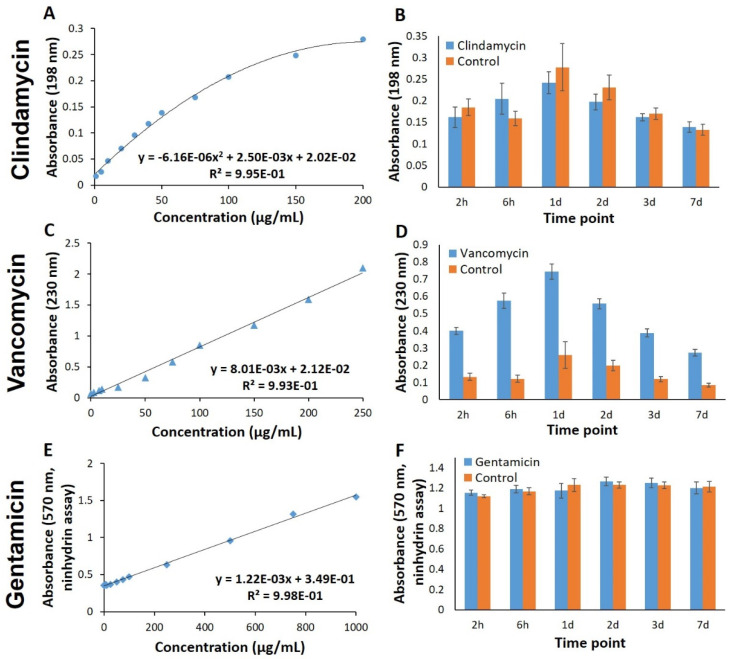
Figure 4.
Spectrophotometric quantification of antibiotics. Standard curves (A,C,E) obtained by measuring the absorbance at 198 nm, 230 nm and Ninhydrin assay of defined concentrations of clindamycin, vancomycin and gentamicin in 0.9% NaCl solution, respectively. Analysis of the release solutions (B,D,F) obtained from antibiotic loaded and unloaded (control) ALG-MC scaffolds, using the respective method (n = 5).

