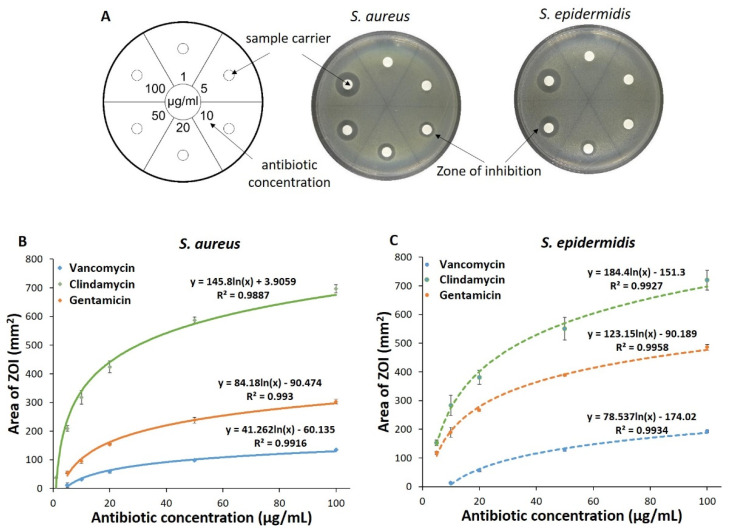
Figure 5.
Adaptation of the agar diffusion test for quantification of antibiotics. A schematic diagram of an agar plate with sample carriers: Numbers in each sector indicate the concentration of antibiotic solution. Example images of the agar plates whose sample carriers were loaded with vancomycin, which led to formation of a clear area (ZOI) around the sample carriers (A). Standard curves of clindamycin, gentamicin and vancomycin obtained by plotting the area of ZOI developed on agar plates containing S. aureus (B) and S. epidermidis (C) vs. respective antibiotic concentration loaded on the sample carriers (n = 3).

