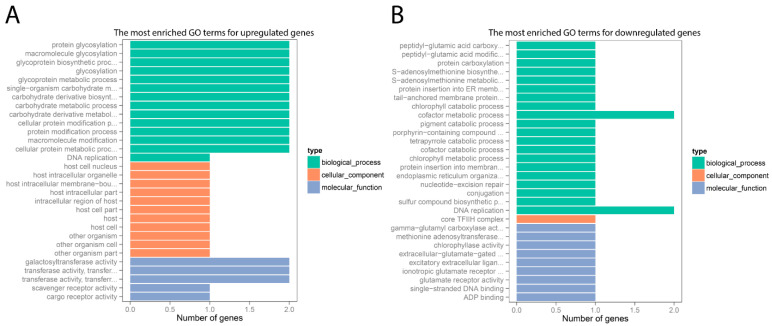
Figure 3.
Functional analysis of upregulated (A) and downregulated (B) genes in chicken jejunum. The x-axis shows differentially expressed gene (DEG) numbers. The y-axis reveals the most enriched GO terms for DEGs. The GO terms of molecular function, cellular component, and biological process classes are compared based on numbers of upregulated and downregulated genes between C. perfringens-infected (CP) and sham control (NV) groups.

