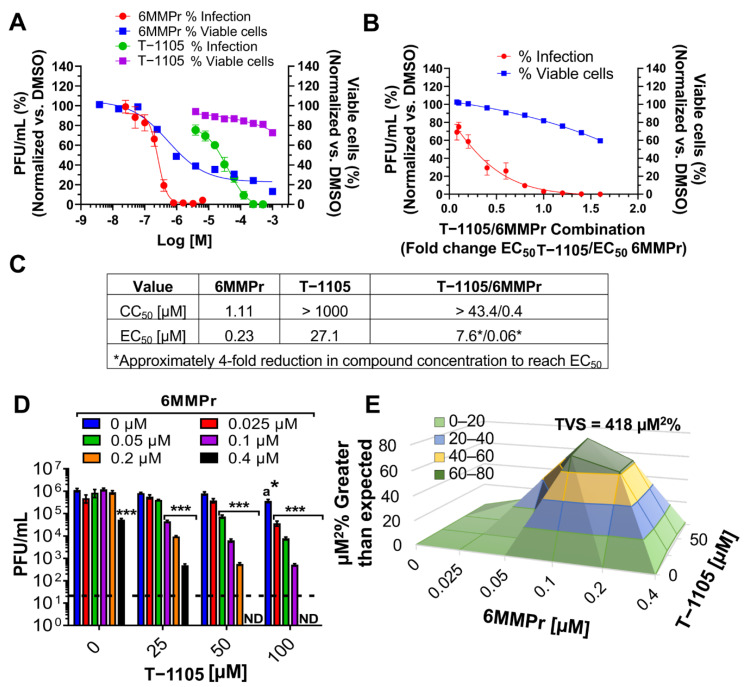
Figure 1.
6MMPr increases T-1105 antiviral activity against DENV in Huh7 cells. (A) Dose-response curves for reduction of viral titers (red and green lines) and cell viability (blue and purple lines) induced by single treatments of 6MMPr and T-1105. (B) Dose-response curves for reduction of viral titers (red line) and cell viability (blue line) induced by T-1105/6MMPr co-treatment. X axis indicates the different combinations used. The doses for 6MMPr and T-1105 for each combination treatment were 0.08, 0.1, 0.2, 0.4, 0.6, 0.8, 1, 1.2, 1.4, and 1.6 times their respective EC50. Data are from three biological replicates. (C) CC50 and EC50 values for 6MMPr, T-1105, and the combination. (D) The bar graph depicts the reduction of viral titer promoted by T-1105/6MMPr co-treatment. X axis represents four different concentrations of T-1105 and the bar color indicates the concentration of 6MMPr. Mean ± SEM of viral titers (PFU/mL) from two independent experiments by duplicates is plotted. (E) 3D plot indicating synergistic antiviral effect. “a”, indicates significant antiviral activity induced by T-1105 alone; *, p < 0.005; ***, p < 0.001; ND, none detected; black dotted line, limit of detection. TVS = total volume of synergy calculated at 99.9% confidence interval.

