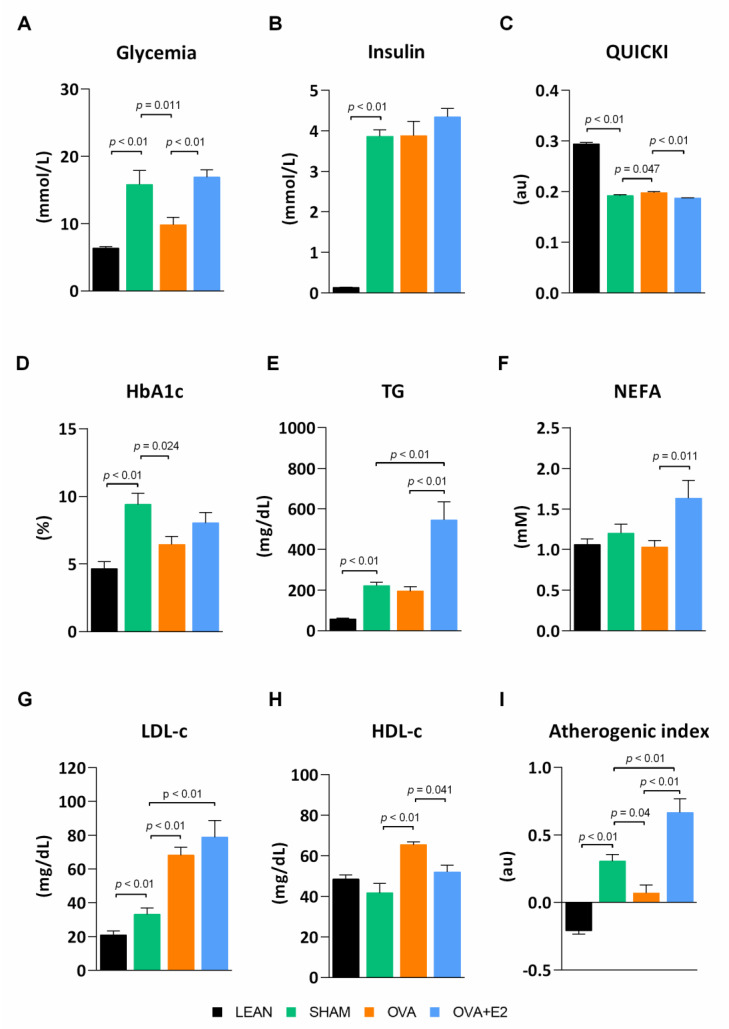
Figure 2.
Ovariectomy and E2 treatment effects on serum metabolic parameters. (A) Glycemia. (B) Insulin levels. (C) QUICKI. (D) HbA1c. (E) TG. (F) NEFA. (G) LDL-c. (H) HDL-c. (I) Atherogenic index of plasma. QUICKI, Quantitative insulin sensitivity check; HbA1c, glycated hemoglobin; TG, triglycerides; NEFA, non-esterified fatty acids; LDL-c, low-density lipoprotein cholesterol; HDL-c, high-density lipoprotein cholesterol. LEAN, control rats (fa/+); SHAM, obese-diabetic (fa/fa) rats undergoing sham surgery; OVA, ovariectomized obese-diabetic (fa/fa) rats; OVA + E2, OVA rats treated with E2 (3 µg/day) for 5 weeks. Values are expressed as the mean ± SEM. Differences between obese-diabetic (SHAM) and control (LEAN) animals were analyzed by Student’s t-test. Differences between obese-diabetic groups with different hormonal manipulation were analyzed by One-way ANOVA with Fisher’s LSD post-hoc test.

