Figure 6.
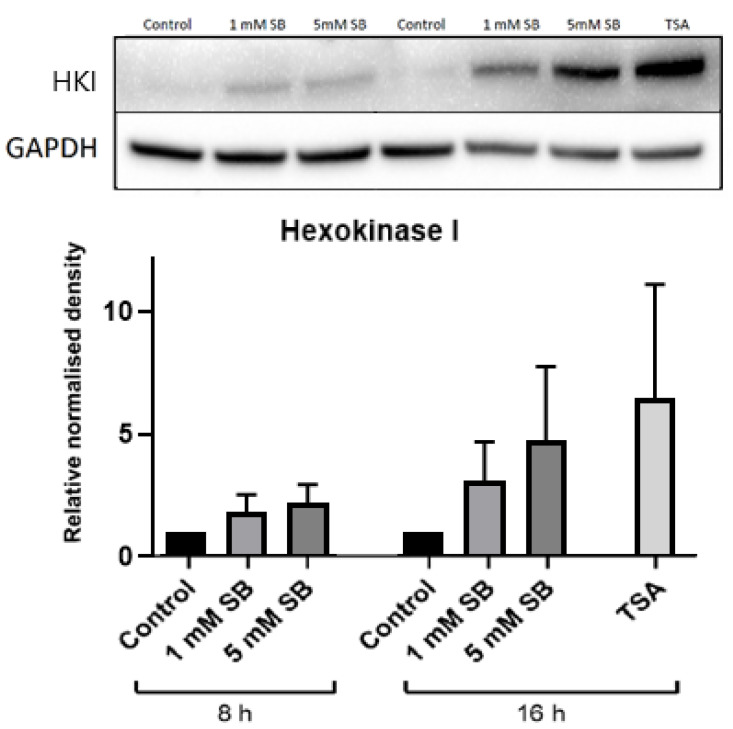
Time-course immunoblot for hexokinase I. Relative protein levels of hexokinase I in HepG2 cells following treatment with 1 mM or 5 mM sodium butyrate for 8 or 16 h or with 2.5 µM TSA for 16 h. The graph represents the mean combined density readings as normalised to GAPDH from three independent experiments, with error bars representing SEMs.

