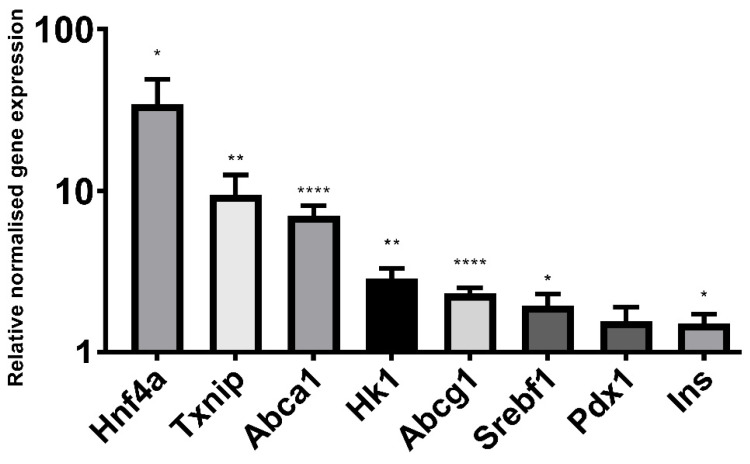
Figure 7.
qPCR of glucose metabolism genes. Relative gene expression in BRIN-BD11 cells treated with 5 mM sodium butyrate compared to the untreated control (value of 1). Gene expression is normalised to reference genes Actb and Rpl13a. Results represent the mean combined from three independent experiments, with error bars representing SEMs. * p < 0.05, ** p < 0.01, **** p < 0.0001.

