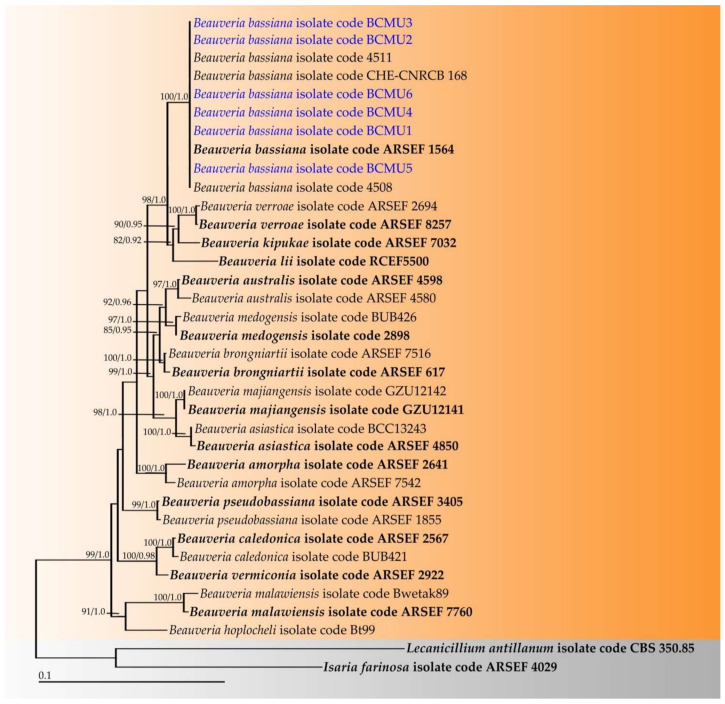
Figure 2.
Phylogram derived from maximum likelihood analysis of 36 sequences of the combined ITS, TEF-1, RPB1, and RPB2 sequences. Isaria farinosa ARSEF 4029 and Lecanicillium antillanum CBS 350.85 were used as the outgroup. The numbers above branches represent bootstrap percentages (left) and Bayesian posterior probabilities (right). Bootstrap values > 75% and Bayesian posterior probabilities > 0.90 are shown. The scale bar represents the expected number of nucleotide substitutions per site. Sequences obtained in this study are in blue. Type strains are indicated in bold.

