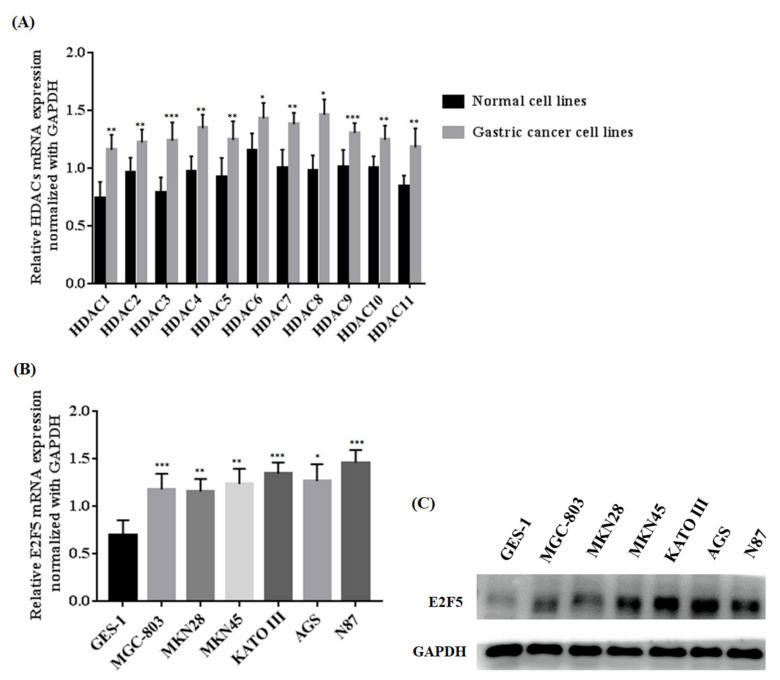
Figure 1.
Determination of HDACs and E2F5 expression in normal (GES-1) and gastric cancer cell lines (MGC-803, MKN28, MKN45, KATO III, AGS, and N87). (A) Represents relative mRNA expression of HDACs (B) Represents relative mRNA expression of E2F5 (C) Western blot results show the protein expression of E2F5 in normal and gastric cancer cell lines using GAPDH as internal control. *: p < 0.05, **: p < 0.005, ***: p < 0.001.

