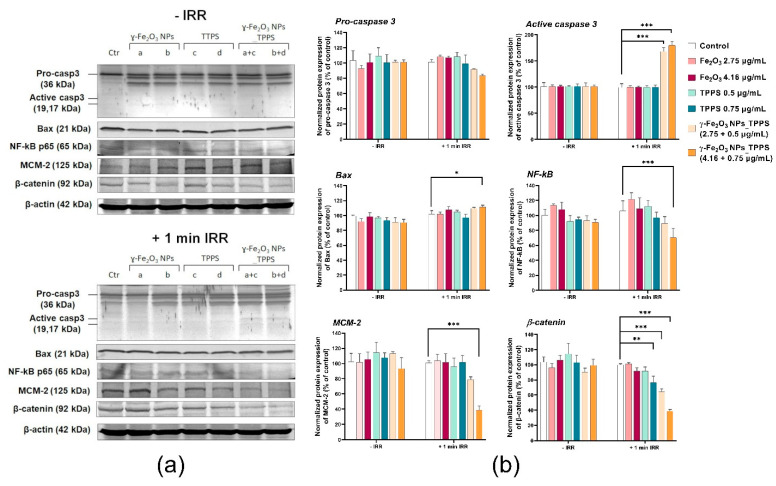
Figure 15.
The protein expression of Pro-caspase 3, caspase 3, Bax, NF-kB, MCM-2 and β-catenin in Mel-Juso cells after 24 h incubation with 2 different concentrations of γ-Fe2O3 NPs, TPPS and their mixture and exposure to no irradiation vs. 1 min irradiation (λ ~ 405 nm, 1 mW/cm2) conditions. (a) Blot bands corresponding to control (Ctr), γ-Fe2O3 NPs (a. 2.75; b. 4.16 μg/mL), TPPS (c. 0.5; d. 0.75 μg/mL) and γ-Fe2O3 NPs_TPPS complex (a+c, b+d); (b) Quantification of blot images. Data (n = 3) were normalized to β-actin and expressed as percentages related to control (100%) ± standard deviation (SD). The results were considered statistically significant when * p < 0.05; ** p < 0.01; *** p < 0.001 (sample vs. control).

