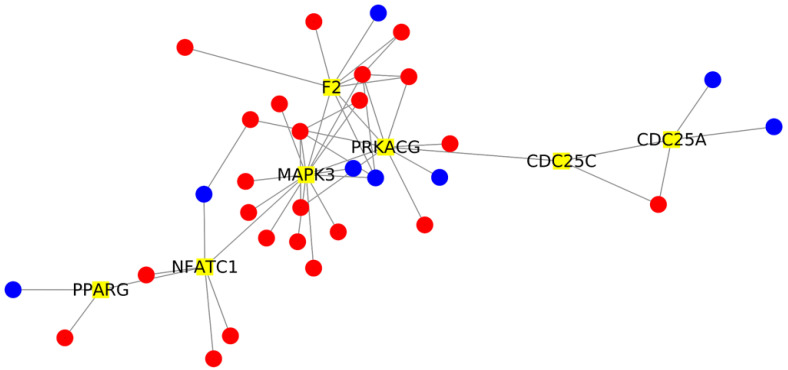
Figure 1.
Network analysis of DEGs interacting with the 7 DEGs with the highest betweenness centrality. The network is composed of 38 nodes. The 7 key DEGs with the highest betweenness centrality are highlighted in yellow. The 31 interactor DEGs identified in the network are depicted in red if they are more expressed in the AD+COVID than AD cohort; otherwise, they appear in blue.

